Visual display at the joints level
The user can view the distribution of stresses using the Stress Distribution command on the taskbar. The Joint and corresponding Combination is selected from the drop-down lists (Figure 178). CADAM3D then displays the distribution of normal stresses (black line), the distribution of uplift pressure (blue line), the upstream and downstream joint cracking if it occurred (red line) and finally the resultant vector of the normal and the shear load (arrow). A sketch of the joint and its central core (area where a vertical load ensures compression throughout the joint) can be displayed when the Sketch joint option is activated. All the numerical values corresponding to the joint and corresponding combinations are displayed at the bottom of the window.
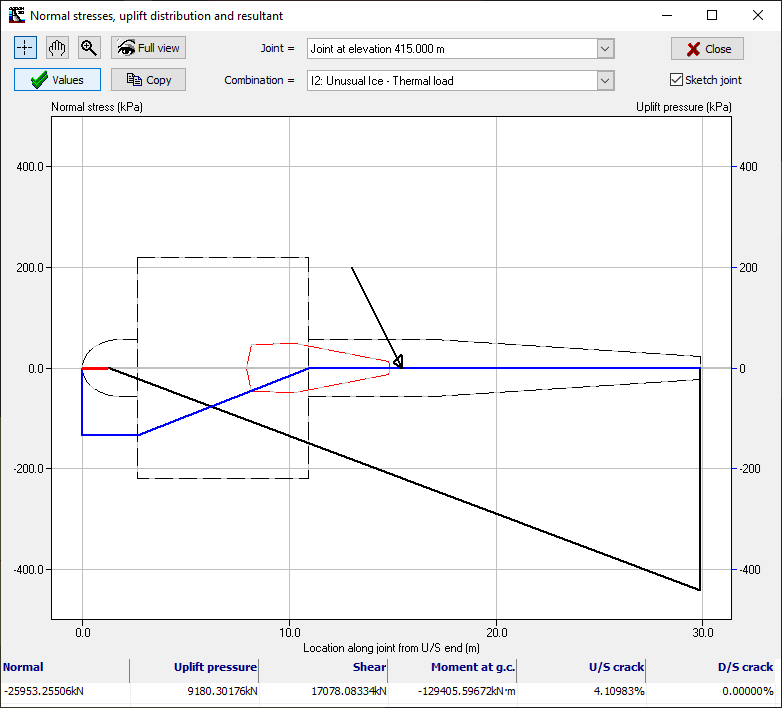
Figure 178